Our 2025-26 Performance

Below you can view our 2025-26 Tenant Satisfaction Measures performance.  

This data was gathered through our management performance information and by our partners TLF Research who contacted a random sample of customers to complete a perception survey about key services that you receive.

Find out more by reading our Tenant Satisfaction Measures FAQs
A person pointing their finger to the green smiley face

Overall Satisfaction 

Platform Cunstomer Annual Report - Happy family sat on a sofa
Start of Stats block slider, skip slider

Stats block slider

  • 69.5 %

    Rented customers that were satisfied with our overall service

    44.2 %

    Shared Ownership customers that were satisfied with our overall service

End of Stats block slider, skip slider

Keeping our homes in good repair

These results relate to our rented customers only.
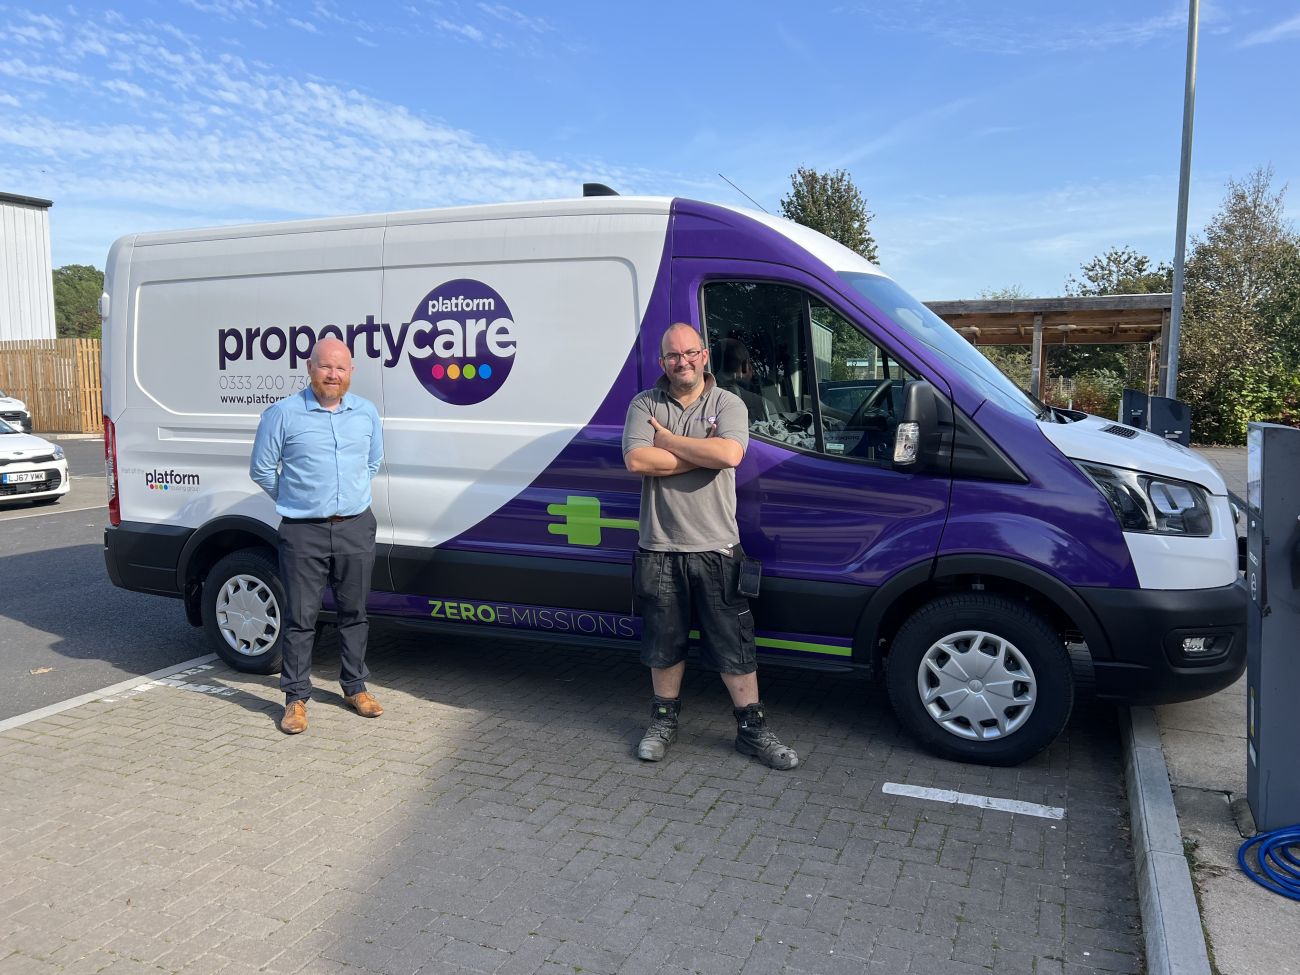
Adam Jones handing over the first electric vehicle to colleague John
Start of Stats block slider, skip slider

Stats block slider

  • 72.5 %

    Overall satisfaction with repairs

    67.8 %

    Satisfaction with time taken to complete repairs

  • 70.8 %

    Satisfaction that your home is well maintained

    99 %

    Homes meet the Decent Homes Standard

  • 96.9 %

    Emergency responsive repairs completed within our target timescales of 24 hours

    94.7 %

    Non-emergency repairs completed within our target timescales of 28 days

End of Stats block slider, skip slider

Maintaining Building Safety

A cardboard cut-out of a house is held between two hands, with the fingers forming a protective roof shape above it. The background is softly blurred with natural green and white tones.
Start of Stats block slider, skip slider

Stats block slider

  • 80 %

    Satisfaction that your rented home is safe

    73.6 %

    Satisfaction that your shared ownership home is safe

  • 100 %

    Homes that required fire risk assessments have been carried out

    100 %

    Homes that required communal passenger lift safety checks have been carried out

  • 100 %

    Homes that required asbestos management surveys or re-inspections have been carried out

    100 %

    Homes that required legionella assessments have been carried out

  • 100 %

    Homes that required gas safety checks have been carried out

End of Stats block slider, skip slider

Respectful and Helpful Engagement

Asian Woman giving a man advice on Universal Credit
Start of Stats block slider, skip slider

Stats block slider

  • 59.4 %

    Satisfaction that we listen and act on rented customers feedback

    36.4 %

    Satisfaction that we listen and act on shared ownership customers feedback

  • 68.7 %

    Satisfaction that we keep rented customers informed about things that matter to you.

    52.4 %

    Satisfaction that we keep shared ownership customers informed about things that matter to you.

  • 75.8 %

    Satisfaction that we treat rented customers fairly and with respect

    57.5 %

    Satisfaction that we treat shared ownership customers fairly and with respect

End of Stats block slider, skip slider

Effective Handling of Complaints

Person looking at their phone - Complaint management Tenant Satisfaction Measures
Start of Stats block slider, skip slider

Stats block slider

  • 40.2 %

    Rented customers satisfied with our approach to complaints handling

    24.8 %

    Shared ownership customers satisfied with our approach to complaints handling

  • 70.8

    Number of stage one complaints received per 1,000 rented homes

    29

    Number of stage one complaints received per 1,000 shared ownership homes

  • 19.1

    Number of stage two complaints received per 1,000 rented homes

    9.4

    Number of stage two complaints received per 1,000 shared ownership homes

  • 93.9 %

    Stage one rented customers complaints responded within the Housing Ombudsman’s Complaint Handling Code timescales

    93.1 %

    Stage one shared ownership customers complaints responded within the Housing Ombudsman’s Complaint Handling Code timescales

  • 89.2 %

    Stage two rented customers complaints responded within the Housing Ombudsman’s Complaint Handling Code timescales

    85.7 %

    Stage two shared ownership customers complaints responded within the Housing Ombudsman’s Complaint Handling Code timescales

End of Stats block slider, skip slider

Responsible Neighbourhood Management

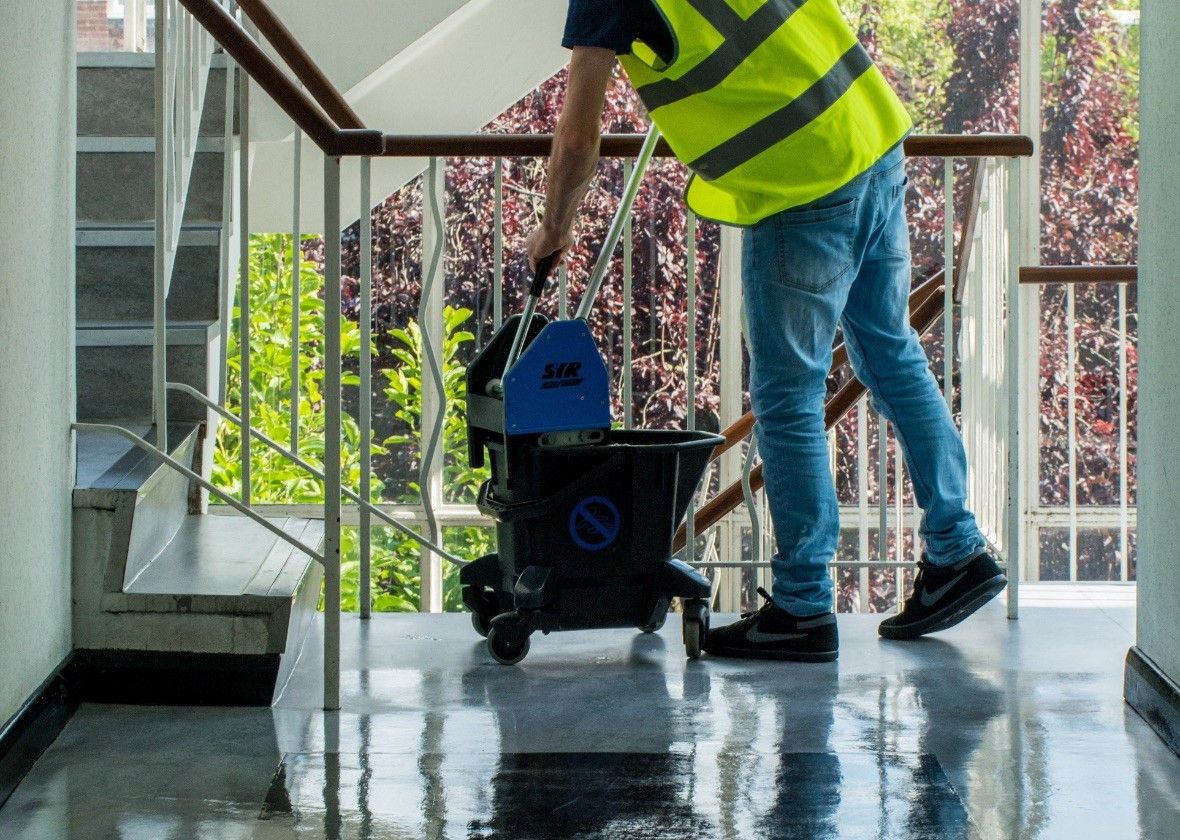
Male in a high-vis vest mopping a staircase floor
Start of Stats block slider, skip slider

Stats block slider

  • 64.0 %

    Rented customers satisfaction with how we keep communal areas clean and well maintained

    50.8 %

    Shared ownership customers satisfaction with how we keep communal areas clean and well maintained

  • 62.0 %

    Rented customers satisfied that we make a positive contribution to their neighbourhood

    42.5 %

    Shared Ownership customers satisfied that we make a positive contribution to their neighbourhood

End of Stats block slider, skip slider

Anti-Social Behaviour Management

Caution Sign - Anti-Social Behaviour Management TSM background
Start of Stats block slider, skip slider

Stats block slider

  • 58.1 %

    Rented customers satisfaction with our approach to handling anti-social behaviour

    34.1 %

    Shared Ownership customers satisfaction with our approach to handling anti-social behaviour

  • 106.2

    Number of anti-social behaviour cases opened per 1,000 homes

    0.7

    Number of anti-social behaviour cases that involve hate incidents opened per 1,000 homes

End of Stats block slider, skip slider

How did we receive these outcomes?

Our partners TLF Research contacted a random selection of customers via phone and email to collect their feedback for the 12 customer perception questions.


To understand more about how we received these outcomes you can find the full list of questions here


Find out more

You can view a full table of our results, broken down into Rented customers and Shared Ownership customers feedback, by clicking on the drop down section below.

Q5a Building safety


Rented Homes

Shared Ownership homes

Combined

BS01

Proportion of homes for which all required gas safety checks have been carried out.


100.00

BS02

Proportion of homes for which all required fire risk assessments have been carried out.


100.0 

BS03

Proportion of homes for which all required asbestos management surveys or re-inspections have been carried out.


100.0 

BS04

Proportion of homes for which all required legionella risk assessments have been carried out.


100.0 

BS05

Proportion of homes for which all required communal passenger lift safety checks have been carried out.


100.0 


Q5b Anti-social behaviour


Rented Homes

Shared Ownership homes

Combined

NM01 (1)

Number of anti-social behaviour cases, opened per 1,000 homes.


106.2 

NM01 (2)

Number of anti-social behaviour cases that involve hate incidents opened per 1,000 homes


0.7 


Q5c DHS and repairs


Rented Homes

Shared Ownership homes

Combined

RP01

Proportion of homes that do not meet the Decent Homes Standard.

1.0%


RP02 (1)

Proportion of non-emergency responsive repairs completed within the landlord’s target timescale.

94.7% 


RP02 (2)

Proportion of emergency responsive repairs completed within the landlord’s target timescale.

96.9% 


Q5d Complaints


Rented Homes

Shared Ownership homes

Combined

CH01 (1)

Number of stage one complaints received per 1,000 homes.

70.8

29.0


CH01 (2)

Number of stage two complaints received per 1,000 homes.

19.1

9.4


CH02 (1)

Proportion of stage one complaints responded to within the Housing Ombudsman’s Complaint Handling Code timescales.

93.9%

93.1%


CH02 (2)

Proportion of stage two complaints responded to within the Housing Ombudsman’s Complaint Handling Code timescales.

89.2% 

85.7%


Q5e Tenant perception measures


Rented Homes

Shared Ownership homes

Combined

TP01

Proportion of respondents who report that they are satisfied with the overall service from their landlord.

69.5% 

44.2%


TP02

Proportion of respondents who have received a repair in the last 12 months who report that they are satisfied with the overall repairs service.

72.5%


TP03

Proportion of respondents who have received a repair in the last 12 months who report that they are satisfied with the time taken to complete their most recent repair.

67.8%


TP04

Proportion of respondents who report that they are satisfied that their home is well maintained.

70.8%


TP05

Proportion of respondents who report that they are satisfied that their home is safe.

80.0%

73.6%


TP06

Proportion of respondents who report that they are satisfied that their landlord listens to tenant views and acts upon them.

59.4%

36.4%


TP07

Proportion of respondents who report that they are satisfied that their landlord keeps them informed about things that matter to them.

68.7%

52.4%


TP08

Proportion of respondents who report that they agree their landlord treats them fairly and with respect.

75.8%

57.5%


TP09

Proportion of respondents who report making a complaint in the last 12 months who are satisfied with their landlord’s approach to complaints handling.

40.2% 

24.8%


TP10

Proportion of respondents with communal areas who report that they are satisfied that their landlord keeps communal areas clean and well maintained.

64.0% 

50.8%


TP11

Proportion of respondents who report that they are satisfied that their landlord makes a positive contribution to the neighbourhood.

62.0%

42.5%


TP12

Proportion of respondents who report that they are satisfied with their landlord’s approach to handling anti-social behaviour.

58.1%

34.1%


A person pointing their finger to the green smiley face

Our 2024-25 Performance

See how we have been working on our overall performance, and compare our outcomes with the Performance Tenant Satisfaction Measures (TSMs) from 2024-25. 


See our 2024-25 Performance here